
COMPARATIVE EM/ FM OPTICAL BENCH REPORT
- September 4, 2026
- CAVU Aerospace UK
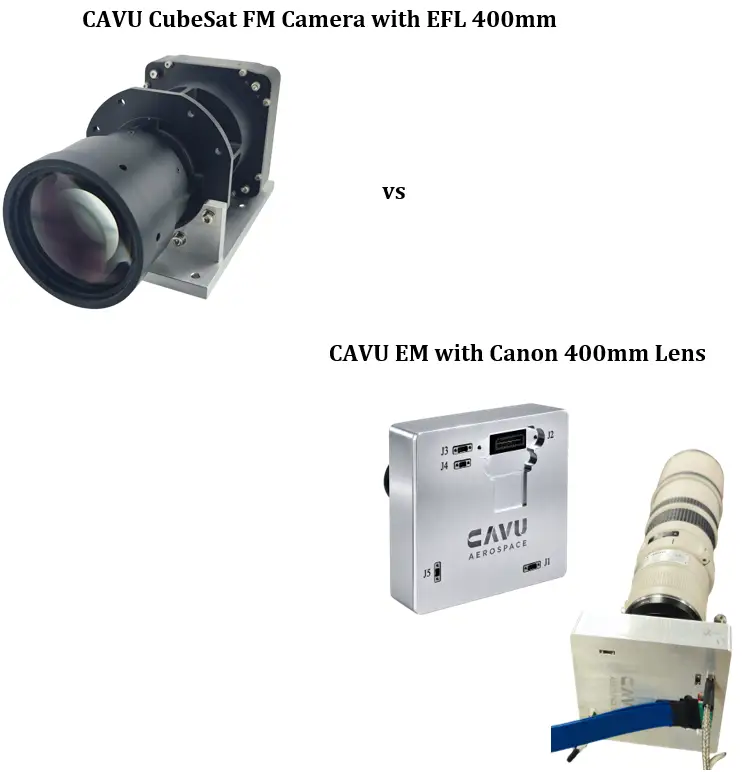
Comparison
This report compares the CAVU CubeSat Camera FM with 400mm EFL with CAVU CubeSat Camera EM with commercial off the shelf Canon lens assembly with 400 mm EFL f/5.6L Both are calibrated broadband grid targets and the same GMAX3405 sensor & C&DH platform while first is space-grade but second is just model for test.
Both image sets at a common f/6.6, 6 ms photometric condition and adds published optical and mechanical data for the two lens systems.
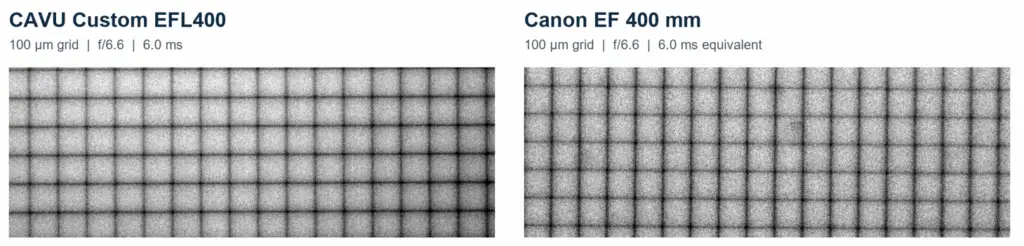
Representative 100 µm grid ROIs at the common f/6.6, 6 ms display condition.
Measurements use original acquisition data.
Overall finding. Both 400mm-class systems reproduced all four target periodicities. FM produced the closer grid-period agreement and lower horizontal/vertical response imbalance across the primary 50-500 µm range. The common-condition figures use equal-size native-pixel regions and the same linear local contrast rule.
Decision-Level Results
Metric | FM | EM with Canon 400 mm | Interpretation |
Mean absolute grid-period error | 0.96% | 2.31% | FM: 58% lower error |
Observed image-scale fit | 1.9999 × | 1.9557 × | FM closer to 2× bench scale |
Mean directional imbalance* | 14.0% | 52.7% | FM more balanced in selected method |
10 µm periodicity | Detected | Detected | Equal native-pixel presentation |
* Mean of the reported 50, 100 and 500 µm directional-imbalance values.
Commercially Defensible Position
Within this bench method, the CAVU FM demonstrates stronger geometric fidelity and more uniform orthogonal response than the Canon reference. A defensible client statement is: “In calibrated broadband grid testing on the same GMAX3405 platform, the CAVU 400 mm optical system achieved approximately 1% mean grid-period accuracy and showed more balanced directional response than the commercial Canon 400 mm reference.”
Qualification. The grid result is a measured integrated-camera comparison. Published CAVU MTF values are reported separately because Canon does not publish a directly comparable 75 lp/mm numeric dataset for this lens.
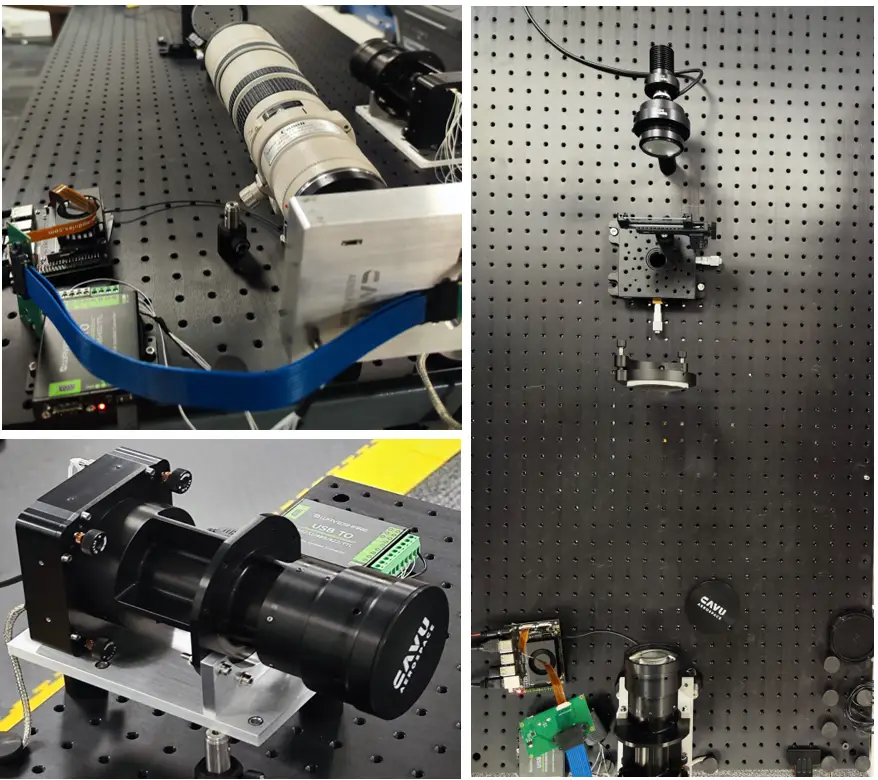
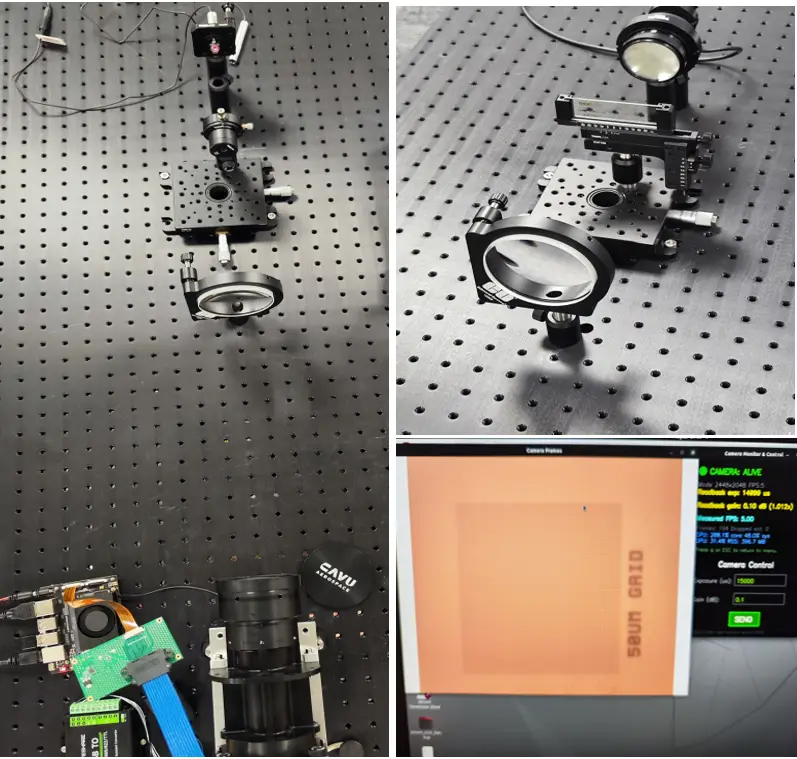
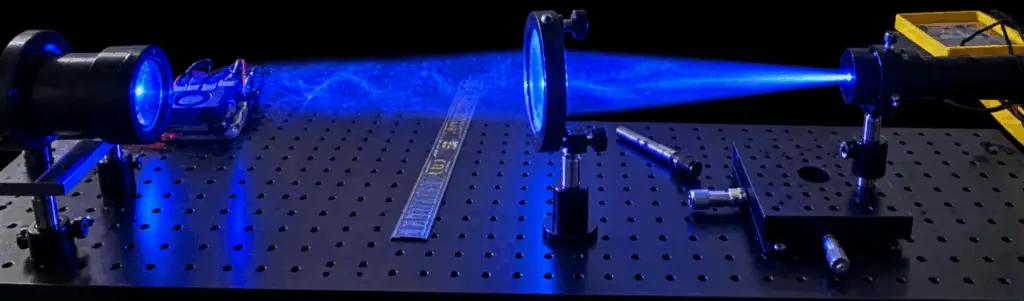
Test Set up
To have faster response, we connected both cameras to NVIDIA GPU for livestream.
1. Objective and Test Basis
The objective was to compare two 400 mm-class imaging systems under the established broadband target bench, quantify how accurately each reproduces known grid periods, and assess directional consistency using a common sensor and collimator architecture.
1.1 System Configuration
Parameter | CAVU FM config. | CAVU EM with Canon reference |
Optics | Custom EFL400 assembly | Canon EF 400 mm f/5.6L USM |
Focal length used | 395.894 mm measured | 400 mm nominal |
Capture aperture | ~60 mm; approximately f/6.6 | f/5.6 capable |
Common report condition | f/6.6; 6.0 ms measured | f/6.6; 6.0 ms |
Sensor | Gpixel GMAX3405; 2448 × 2048; 3.4 µm | Same |
Collimator | Edmund 75 mm achromat; 200 mm EFL | Same |
Illumination | Broadband LED; approximately 3 V / 2 mA | Same bench architecture |
Grid source exposure | 6.0 ms | 2.5 ms |
Targets | 10, 50, 100 and 500 µm positive grids | Same target set |
1.2 Expected Image Scale
For a target near the focal plane of a 200 mm collimator, the expected image magnification is approximately f_camera / f_collimator. This gives 1.9795× for the measured CAVU EFL and 2.000× for the nominal Canon focal length. Expected sensor periods follow from target pitch, magnification and the 3.4 µm pixel pitch.
1.3 Common-Condition Calculation
Photometric exposure is proportional to shutter time divided by f-number squared. Converting the Canon grid presentation from f/5.6 at 2.5 ms to the f/6.6, 6 ms report condition gives a linear signal factor of 1.728 (+0.79 stop). This scalar conversion changes image level, not grid spacing or the ratio of equal-frequency horizontal and vertical responses.
Canon condition | t/N² | Relative to source |
Measured source: f/5.6, 2.5 ms | 0.0797 | 1.000× |
Common report condition: f/6.6, 6.0 ms | 0.1377 | 1.728× |
1.4 Measurement and Image Preparation
Measurements. Grid-period and directional values come from original acquisition data using the campaign frequency-domain method.
Figures. CAVU RAW data were demosaiced from GBRG Bayer data.
Cleaning. Presentation regions were selected from clean portions of the target. No sharpening, denoising, synthetic detail, geometric correction or resampling was applied.
2. Geometric Grid-Period Accuracy
The detected grid period was compared with the period predicted from target pitch, camera focal length, collimator EFL and sensor pixel pitch. Across all four targets, CAVU remained close to a +1% signed error; the Canon reference remained near -2.3%. The f/6.6, 6 ms photometric projection does not change these spatial periods.
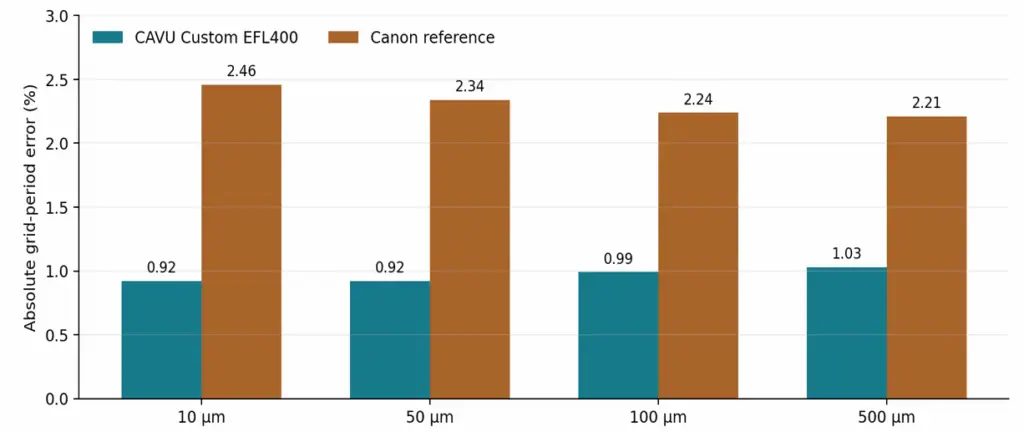
Absolute grid-period error by target. Lower is closer to the bench prediction.
Target | CAVU exp. | CAVU det. | CAVU error | Canon exp. | Canon det. | Canon error |
10 µm | 5.82 | 5.88 | +0.92% | 5.88 | 5.74 | -2.46% |
50 µm | 29.11 | 29.38 | +0.92% | 29.41 | 28.72 | -2.34% |
100 µm | 58.22 | 58.79 | +0.99% | 58.82 | 57.50 | -2.24% |
500 µm | 291.10 | 294.11 | +1.03% | 294.12 | 287.62 | -2.21% |
Expected & detected periods in sensor pixels.
Signed error is relative to each system’s predicted period.
Interpretation. The mean absolute error is 0.96% for CAVU and 2.31% for Canon, a 58% relative reduction in this dataset. This supports a stronger image-scale fidelity result for CAVU, but the bench geometry does not independently determine absolute focal length because collimator principal-plane location and focal-length tolerance also contribute.
3. Representative Grid Images
The following views use equal-size native-pixel target regions. Each region receives the same neutral-grayscale and local linear-contrast procedure, making scale and framing directly comparable while preserving the recorded spatial detail.
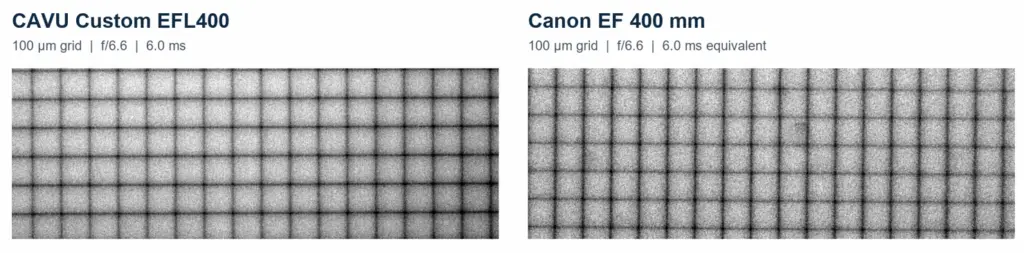
100 µm grid comparison at the common f/6.6, 6 ms presentation condition.
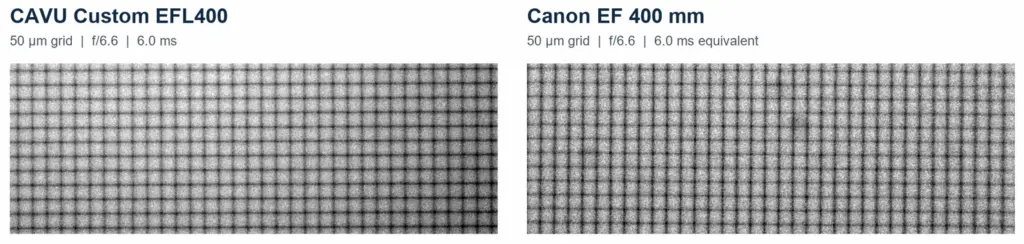
50 µm grid comparison at equal native-pixel scale.
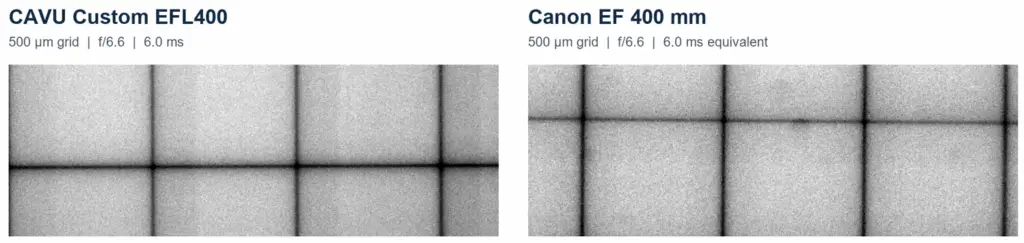
500 µm grid comparison at equal native-pixel scale.
4. Directional Response Balance
A comparative directional-imbalance metric was calculated from the two orthogonal periodic responses. Because the common-condition conversion is a scalar signal calculation, the reported horizontal/vertical ratios are unchanged. Lower values indicate a more even response between the grid directions in this bench configuration.
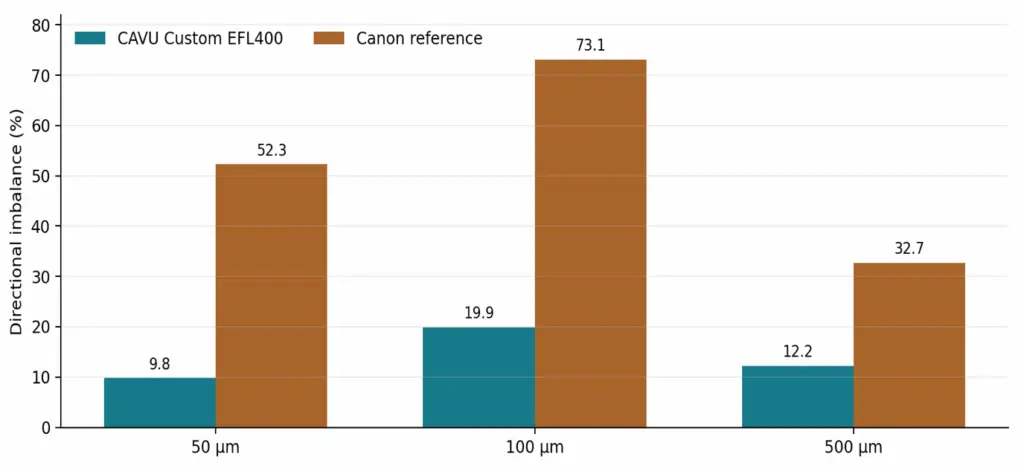
Reported horizontal/vertical response imbalance.
Lower values indicate better balance between the two grid directions.
Grid pitch | CAVU imbalance | Canon imbalance | CAVU reduction vs Canon |
50 µm | 9.8% | 52.3% | 81% |
100 µm | 19.9% | 73.1% | 73% |
500 µm | 12.2% | 32.7% | 63% |
Directional-balance comparison from the campaign’s selected analysis method.
Result. CAVU FM shows materially lower imbalance at all three primary grid pitches. The result supports a more uniform orthogonal response in the tested field and configuration and should be confirmed by the planned two-direction slanted-edge test.
5. Fine-Grid Behaviour
The 10 µm grid corresponds to approximately six sensor pixels per period. Rev C uses equal 350 × 350 pixel regions, the same displayed size and the same local linear-contrast rule for both lenses. This removes the unequal visual scale present in the earlier layout. The periodic component is detected in both datasets.
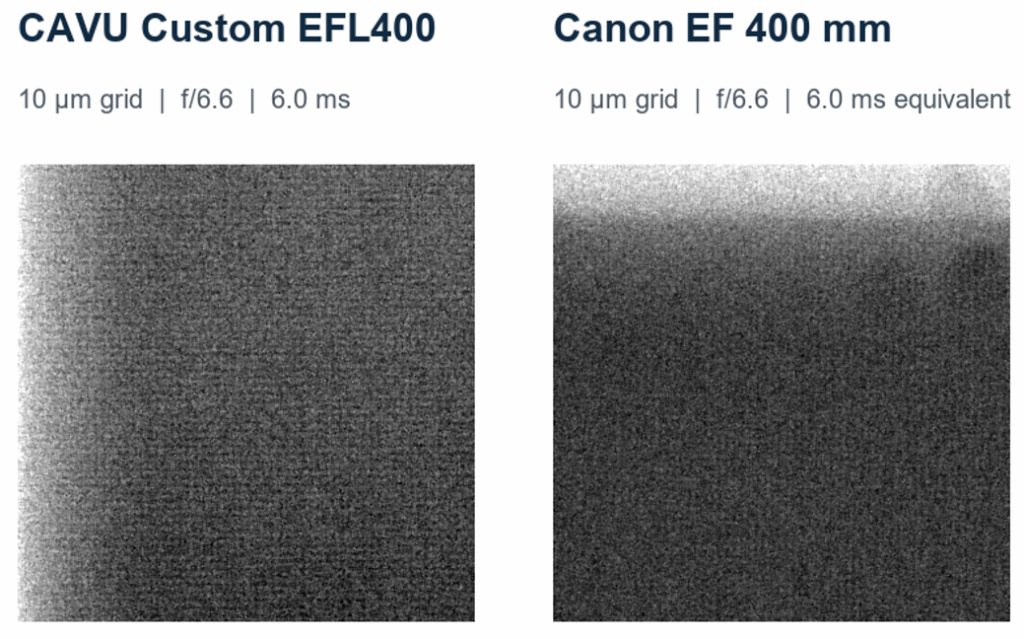
Equal 350 × 350-pixel views of the 10 µm targets.
Both datasets retain the measured periodic component.
5.1 Interpretation Notes
Photometric equivalence. Canon signal level is calculated for f/6.6 and 6 ms; the source optical image was recorded at f/5.6.
Metric basis. Period and balance values remain tied to the original captures and the stated analysis procedure.
Field coverage. This comparison does not replace center, 70%-field and full-field slanted-edge MTF testing.
5.2 Supported Result
The evidence supports a comparative statement about calibrated grid-period accuracy and directional balance in this broadband bench configuration. It also confirms that both systems transmit the finest target periodicity sufficiently for frequency-domain detection.
6. Optical and Integration Data
The CAVU technical scheme provides design-performance values for the dedicated visible-band lens. Canon publishes product specifications for the EF 400 mm f/5.6L USM, but no directly comparable numeric MTF value at 75 lp/mm. The table therefore preserves each source definition and avoids converting unlike MTF datasets.
Parameter | CAVU FM EFL400 | Canon EF 400 mm f/5.6L | Comparison |
Focal length | 400 mm design; 395.894 mm measured | 400 mm nominal | Same focal-length class |
F-number / pupil | f/6.7 design; 60 mm pupil | f/5.6 maximum; 71.4 mm pupil | Common report condition uses ~60.6 mm pupil |
MTF at 75 lp/mm | 0.36 axis; 0.29 at 70%; 0.20 full field | No official numeric value published at 75 lp/mm | CAVU FM has the directly specified GMAX-relevant dataset |
Absolute distortion | 0.2% at full field (design) | Not numerically published in cited Canon data | No direct manufacturer comparison |
Relative illumination | 98% full field (design) | Not numerically published in cited Canon data | No direct manufacturer comparison |
Field / coverage | 1.6° diagonal; 11.2 mm image circle | 6°10′ diagonal on 35 mm format | Different intended sensor formats |
Optical construction | 7 lenses | 7 elements in 6 groups | Both seven-element designs |
Maximum length | 200.0 mm | 256.5 mm | CAVU FM 22.0% shorter |
Mass | 1,167.4 g | 1,250 g | CAVU FM 6.6% lighter |
7. Summary
- CAVU FM leads the measured grid comparison in geometric period accuracy & orthogonal response balance.
- Mean absolute period error is 0.96% for CAVU versus 2.31% for Canon &
- CAVU directional imbalance is substantially lower across the 50-500 µm targets.